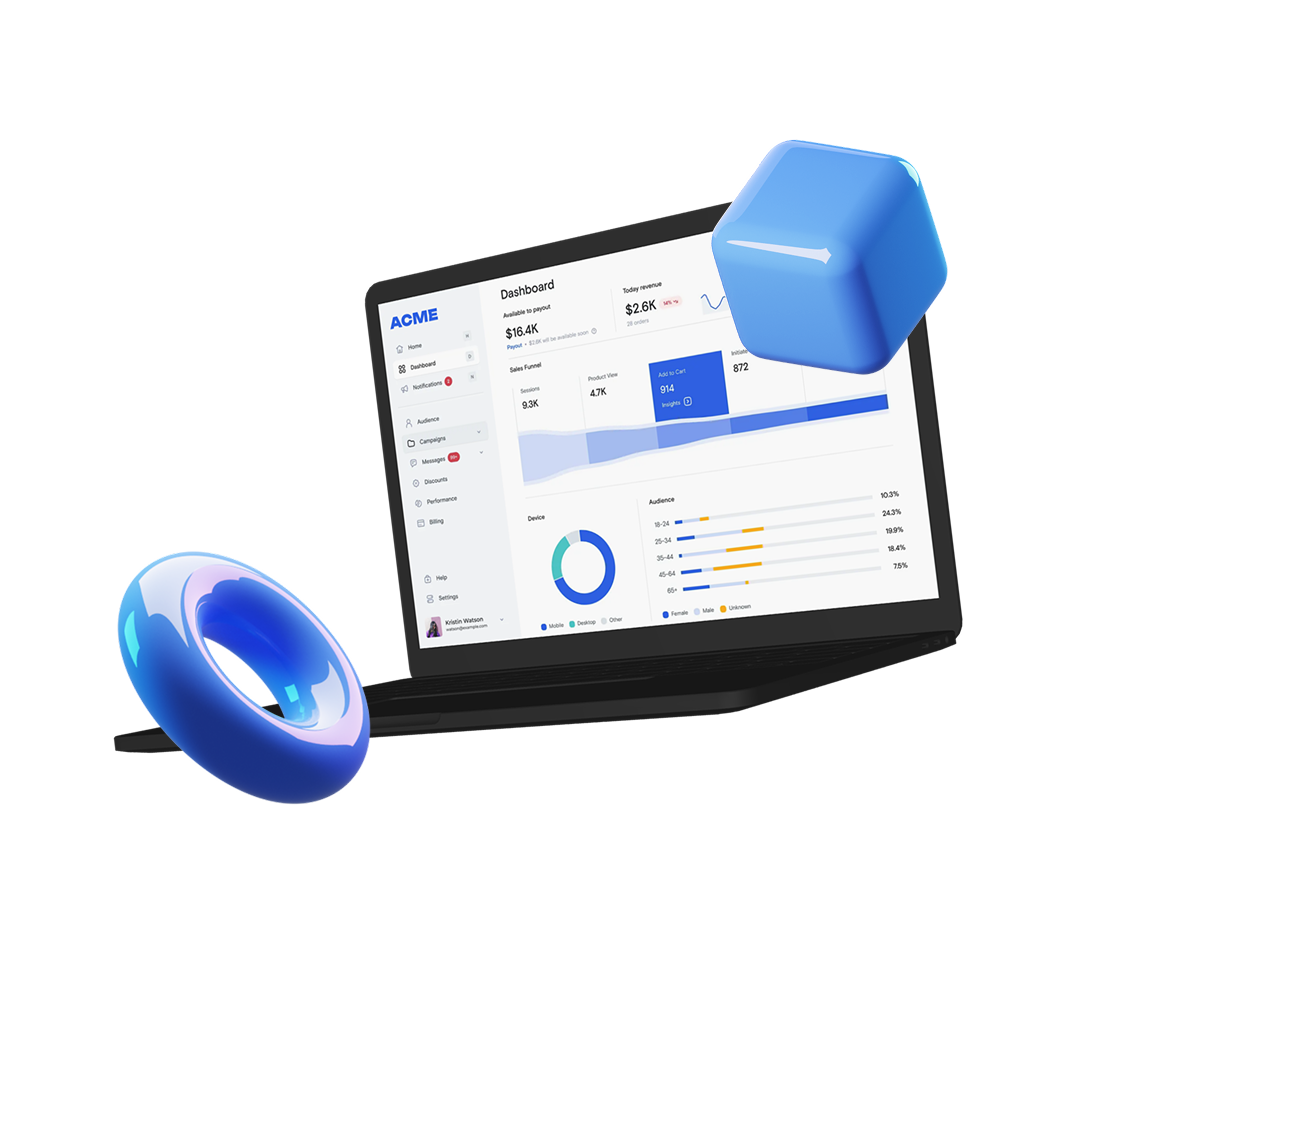
Centralized BI & Metrics Platform
2024
Centralized BI & Metrics Platform
A tailored BI solution for a mid-sized U.S. eCommerce company that unified operational data into accessible dashboards and automated recurring reporting across sales, logistics, and marketing.
Real-Time Business Visibility for eCommerce Operations
About project
A tailored BI solution for a mid-sized U.S. eCommerce company that unified operational data into accessible dashboards and automated recurring reporting across sales, logistics, and marketing.
Challenge
Our client — an eCommerce company with 80+ employees — was growing across multiple sales channels (Shopify, Amazon, and DTC), but lacked centralized visibility into performance.
Key issues:
- Operational and marketing data were scattered across spreadsheets, platforms, and tools
- Weekly reports were built manually and inconsistently
- Business users couldn’t easily track metrics without technical support
- There was no shared, up-to-date view of core KPIs across departments
They needed a scalable BI solution to consolidate data, reduce manual reporting, and give teams real-time access to trusted business metrics — without requiring SQL or full-time analysts.
Solution
1. Data Infrastructure & Integration
We implemented a lightweight ETL pipeline using Airbyte to connect and sync:
- Shopify and Amazon (orders, fulfillment, returns)
- ERP and warehouse systems
- Google Sheets (for budgeting and ops)
- Marketing sources: Facebook Ads, Google Ads, Klaviyo
All data was normalized into a PostgreSQL data warehouse, structured around shared business dimensions.
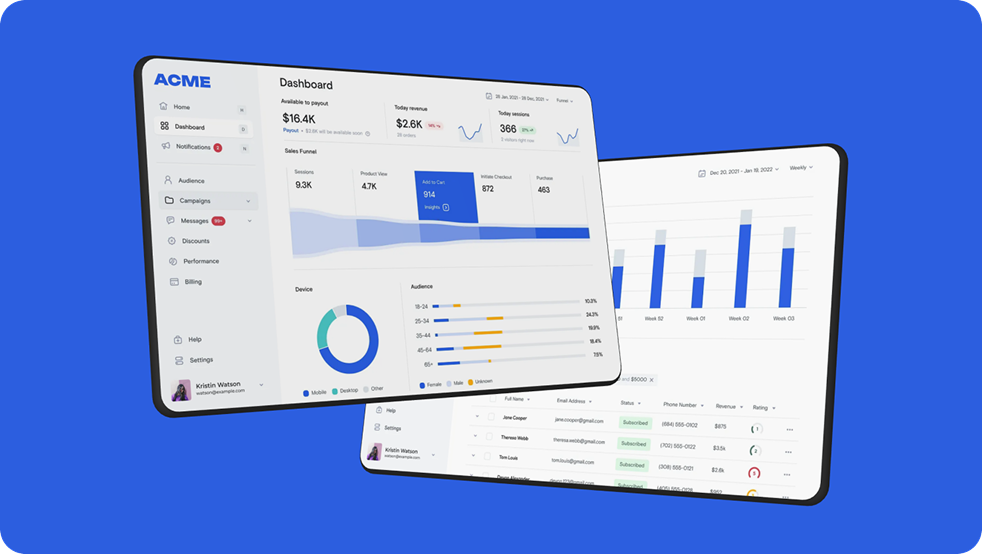
2. Role-Based Dashboards
We designed pre-built dashboards in Metabase (self-hosted), tailored by team:
- Executive: Revenue, margins, CAC trends
- Marketing: Channel performance, ROAS, campaign metrics
- Logistics: Inventory movement, order delays, delivery SLAs
- Procurement: Restock triggers, vendor timelines, stock coverage
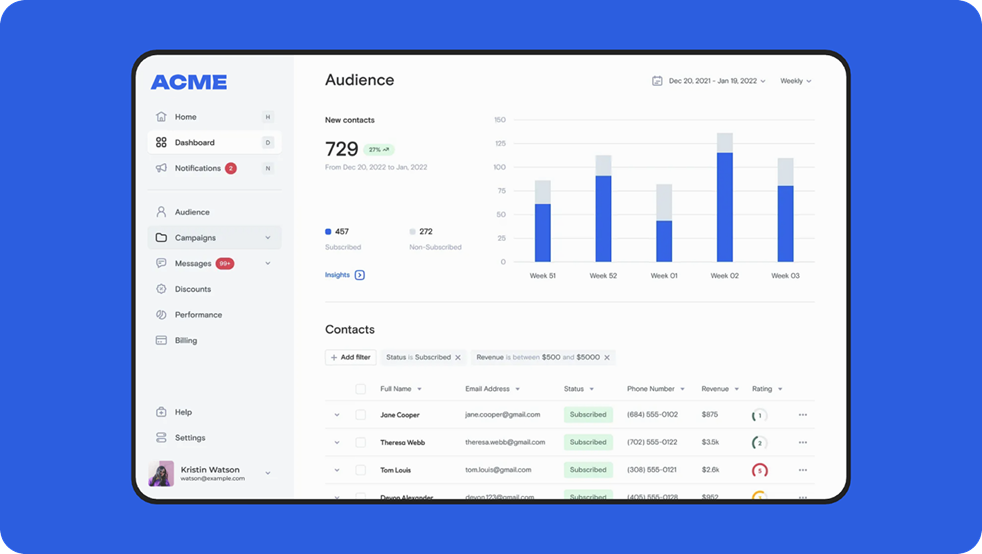
Each dashboard included filters by product, channel, and timeframe, with no need for manual SQL queries.
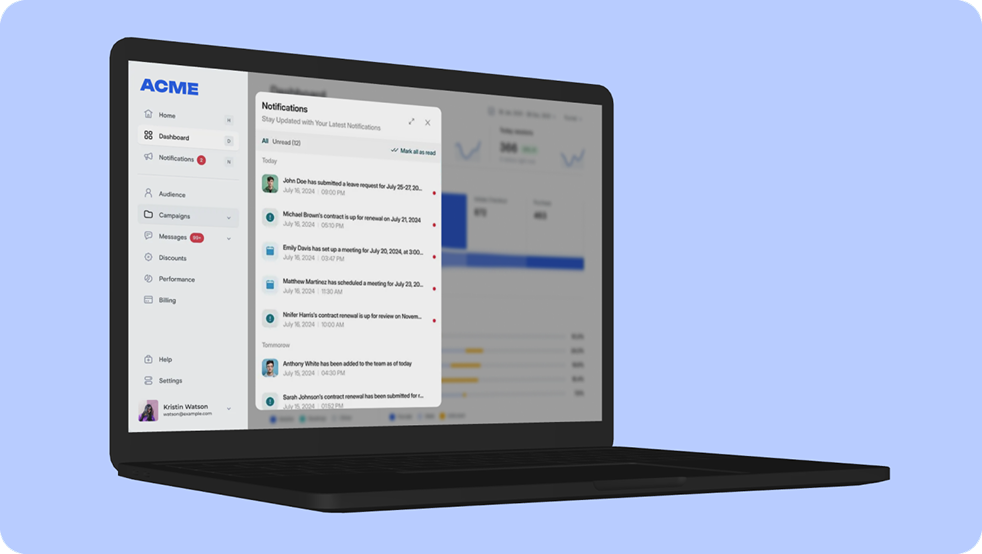
3. Automation & Alerts
- Weekly summary reports were scheduled via Slack and email (PDF or Excel)
- Alerts triggered when specific KPIs fell below thresholds (e.g., ROAS < 2.0)
- Dashboard exports supported team reporting and leadership meetings
Project Team
- 1 Project Manager
- 1 Data Engineer
- 1 BI Analyst
- 1 Backend Developer
- 1 QA Engineer
Tech stack


Timeline
Total duration: ~10 weeks for MVP
Weeks 1–2
Data source audit, metric mapping, warehouse design
Weeks 3–4
ETL setup and testing
Weeks 5–7
Dashboard development for key teams
Weeks 8-9
Reporting logic, alert configuration, QA
Weeks 10
Slack + Google integration, SSO setup
Weeks 18-19
QA, refinements, role-based testing
Weeks 20
Full company rollout, HR onboarding, documentation handoff
Note: Iterative improvements and new data integrations continued over the following month.
Impact
The BI platform gave the client a clear, consistent view of business operations — accessible to both technical and non-technical users.
- According to internal tracking, report preparation time dropped by over 70%, saving several hours weekly across departments
- More than 60% of operational and business-facing staff accessed dashboards weekly
- Non-technical users were able to explore routine performance metrics without relying on analysts
- Procurement teams identified restocking needs earlier, reducing supply gaps
- Leadership now uses unified dashboards in weekly planning meetings
Business Outcome
Faster decisions, reduced reporting overhead, and shared alignment across sales, marketing, and operations — all without increasing headcount.